Claude Code · prompt caching · 59 days of logs
I cannot hit my Claude Code limit, and the logs explain why
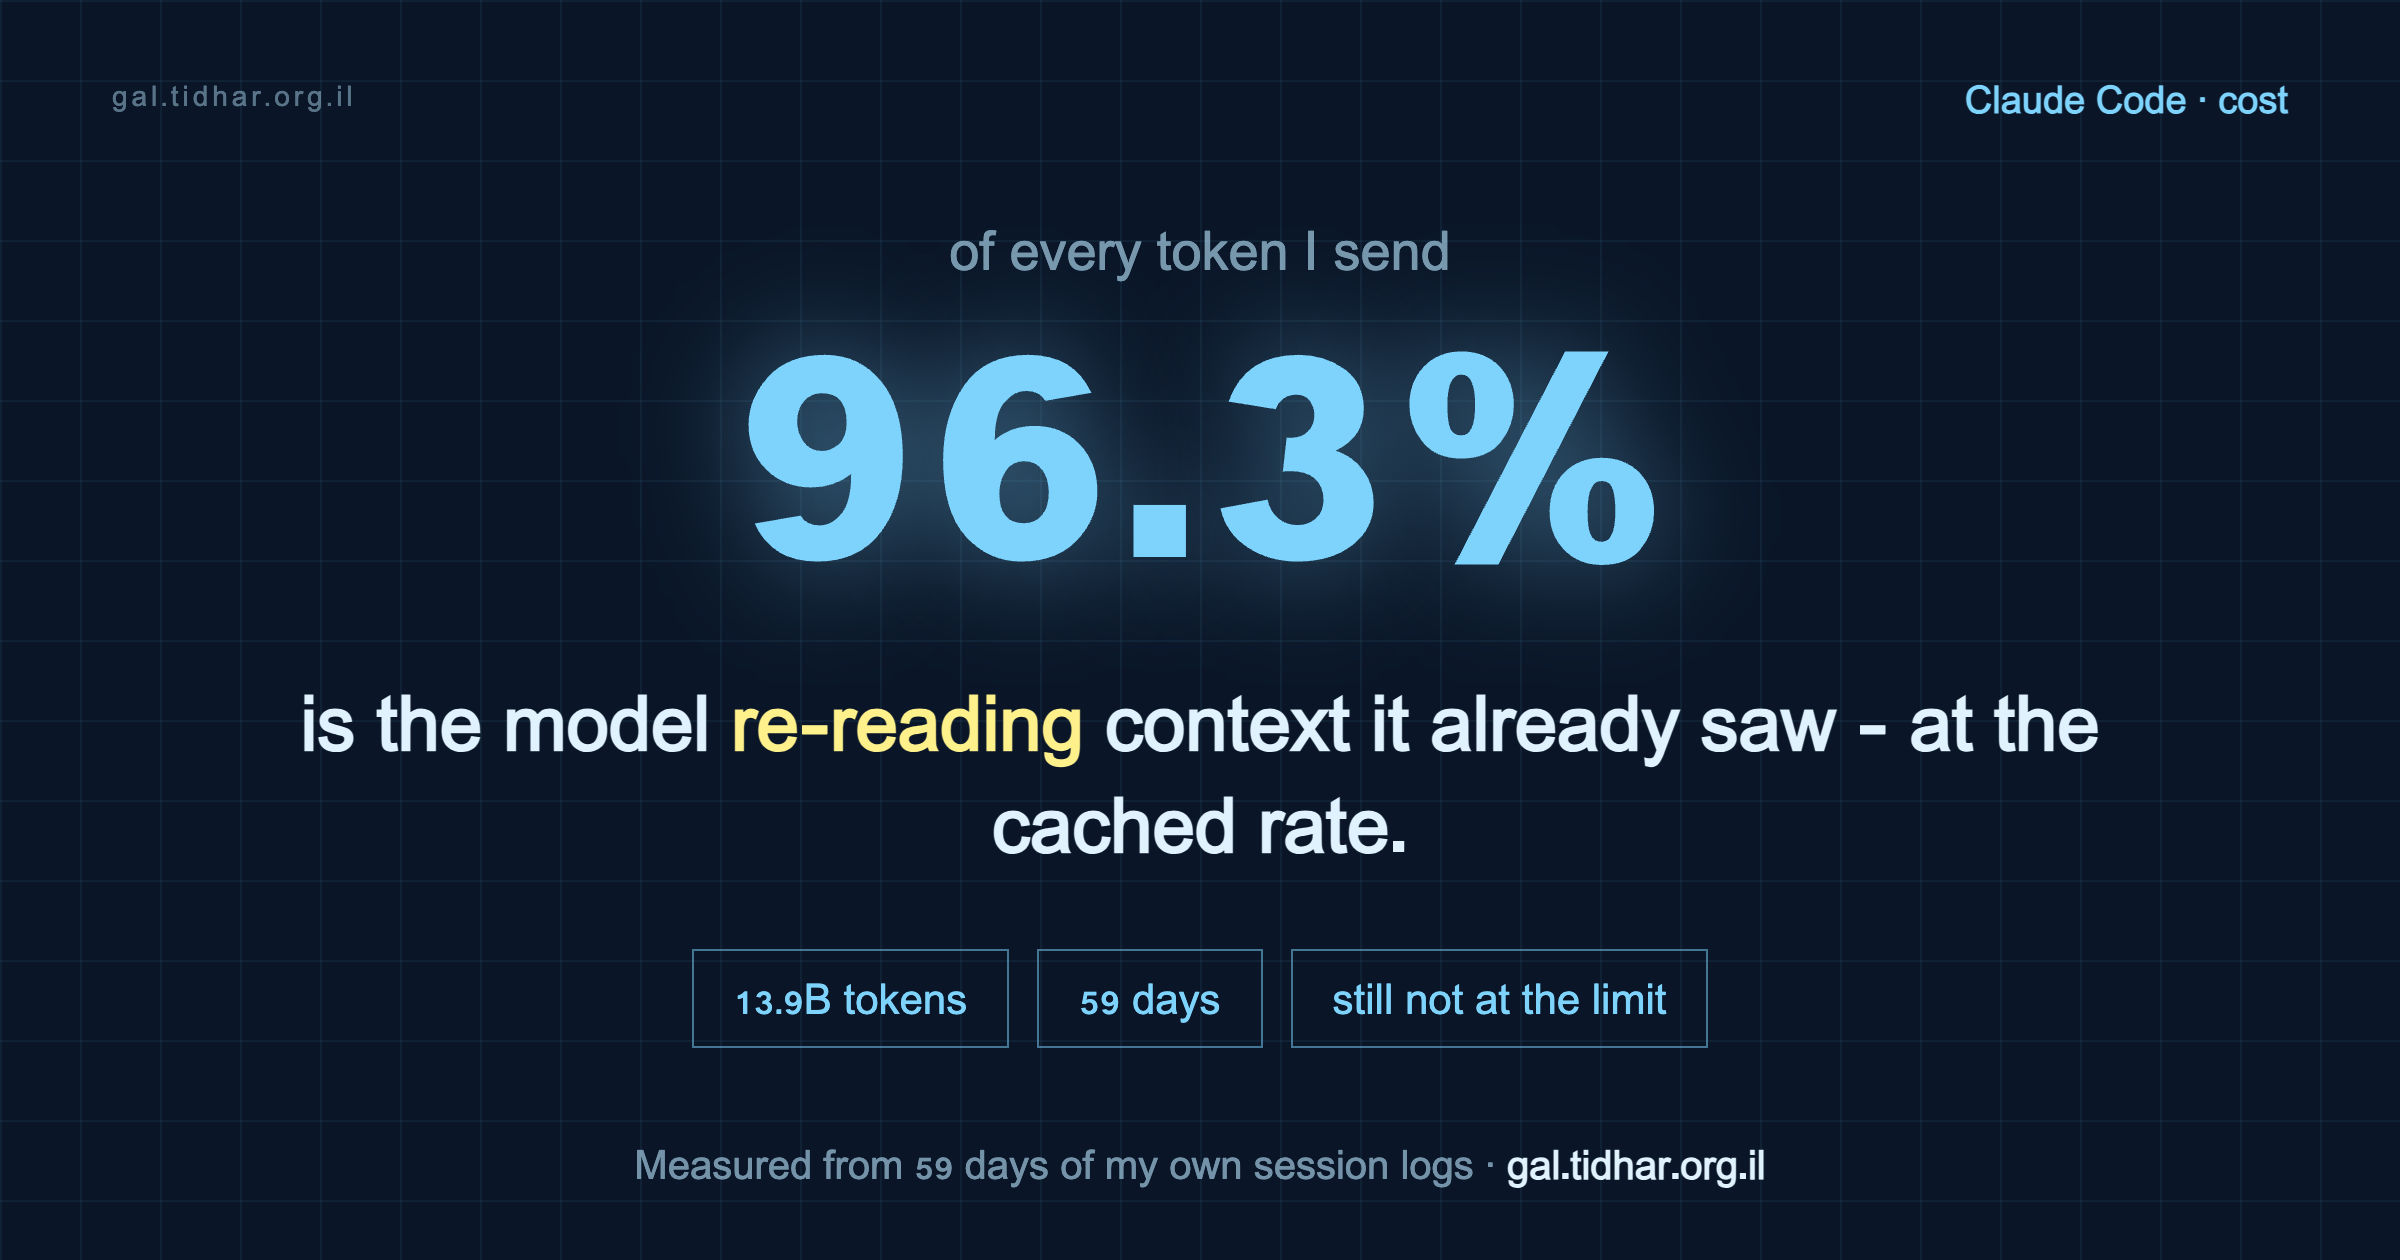
Every week I see someone burn through their plan in days and buy a second one. I am a heavier user than most of them — 13.9 billion tokens in two months — and I almost never touch my limit. That gap bothered me enough to open my own logs. One number explains it: 96.3% of my tokens are cache reads, and cache reads draw your plan limit at the cached rate.
The receipts
Read out of local session logs with ccusage, over 59 days (2026-06-11 to 2026-08-08):
| Metric | Value |
|---|---|
| Total tokens | 13,932M (13.9 billion) |
| Cache reads | 13,418M — 96.3% of all tokens |
| Busiest single day | 1,655M tokens |
| Plan | Max 20x |
| 7-day window, typical | around a third consumed |
Why the ratio decides everything
Claude does not remember your conversation. The API is stateless, so on every single turn Claude Code re-sends the entire conversation from the beginning. Your typing and the model's replies are a rounding error next to that.
Prompt caching is what makes that survivable, and it works as a prefix match. If the beginning of the request is byte-identical to the previous turn's, that span is re-read at the cached rate instead of being reprocessed.
Here is the part that took me a while to internalise, and it is the whole article:
Your plan limit is consumed by tokens processed, and the cached rate applies to the limit too. A cache read is not just cheaper, it eats less of your allowance. The same work, cached, moves you toward the ceiling far more slowly.
Which means I am not doing less work than the people who run out. I am doing the same work without breaking the cache. The official docs put it plainly: with prompt caching, Claude Code re-reads history at the cached token rate, so a one-line question in a session that has been open all day still draws usage for the whole conversation.
The trap: the most expensive turn of your day
What breaks it is a cache miss. On a subscription the cache lifetime is one hour. Come back to a large session after two hours, type one line, and that line reprocesses the entire conversation at full rate.
It is the single worst turn you will take all day, and it is disguised as a small question. Multiply it by a few abandoned sessions and that is a plan burned in days, with nothing on screen to explain it.
One rule, five ways to keep it
These are not five separate tips. They are five ways of not breaking the same thing. Keep the prefix stable and keep it small.
1. Never switch models mid-session
Caches are model-scoped. Switching the main model mid-conversation invalidates the whole prefix and rebuilds it. Pick at session start and stay. Routing work to a cheaper model inside a subagent is free of this problem, because the subagent has its own context.
2. Make the cheap model a default, not a decision
My tiers are Opus in the main loop, Sonnet for agents, Haiku for anything touching a browser. The part worth copying is not the tiering, it is the block in CLAUDE.md that makes it automatic:
## Agent model selection

**Default is haiku. You must explicitly justify sonnet or opus.**

| Task type                                    | Model  |
|----------------------------------------------|--------|
| Read files, grep, ls, count, gather data     | haiku  |
| Browser automation, UI checks, form filling  | haiku  |
| Implementation, refactoring, debugging       | sonnet |
| Architecture, novel debugging, cross-cutting | opus   |

Rule: if you are about to write model="sonnet" for a read/search/count/
browser task, change it to haiku.
I counted what that produces. Over the last 30 days, across 375 session files:
| Subagent dispatches | Count | Share |
|---|---|---|
Explicitly haiku | 629 | 58.0% |
Explicitly sonnet | 410 | 37.8% |
Explicitly opus | 23 | 2.1% |
| No model set (inherits) | 23 | 2.1% |
| Total | 1,085 |
About 21 Haiku subagents a day, 827 of them plain general-purpose one-offs. The telling row is the last one: only 2% fall through without a model. The policy is doing the choosing, not me. That is the difference between a habit and a default — a habit survives a calm Tuesday, a default survives a bad week.
You can set the model on a subagent definition or on a skill:
# ~/.claude/agents/researcher.md
---
name: researcher
description: Reads and searches; returns conclusions only.
model: haiku
---

# ~/.claude/skills/validate-mock/SKILL.md
---
name: validate-mock
model: haiku       # applies for the rest of the turn
effort: low
context: fork      # runs in its own forked context...
---                # ...and with fork, `model` sets the forked agent's model
3. Push every noisy job into a subagent
A subagent starts with a clean context, reads what it needs, and throws all of it away. Only the conclusion comes back. In the last 30 days 843M tokens of reading went through subagents without entering my main window — and therefore without being re-read on every subsequent turn for the rest of the day.
Where the tokens ran overall:
| Model | Tokens | Share |
|---|---|---|
| Opus 4.8 | 9,751M | 70.0% |
| Opus 5 | 2,565M | 18.4% |
| Haiku 4.5 | 957M | 6.9% |
| Sonnet 5 | 529M | 3.8% |
4. Compact early
A window that has drifted to 85% full is re-read at 85% full on every subsequent turn for the rest of the session. Compacting early makes every later turn lighter; it pays for itself within a few turns and keeps paying. I set CLAUDE_AUTOCOMPACT_PCT_OVERRIDE to compact well before the default.
5. A deep shelf is fine. A shelf that moves is not.
Every installed skill's name and description sits in every session's system prompt and is re-read on every turn. Mine:
| Component | Tokens |
|---|---|
| Skills (frontmatter only, 164 skills) | 16,513 |
| Core system | 12,900 |
| CLAUDE.md + memory index | 2,074 |
| Measured session baseline | 51,013 |
51k tokens before I type a word. That sounds like a permanent tax and I assumed it was one, until I looked at where it sits. Those descriptions never change, so they land in exactly the part of the prefix that caches, and after the first turn they are re-read at the cached rate forever.
Which is the thesis in one example: size is not what costs you, movement is. A large static block is the cheapest context you can own; a small volatile one at the front of the prompt is the most expensive. What a deep shelf really costs is window space and selection noise — more descriptions mean more chances of reaching for the wrong one.
Two things that are not settings
One workspace per task, because it is easier
I run cmux with seven workspaces open, and every task gets its own. This sounds like tidiness. It is really about friction.
The default failure mode is one window that slowly absorbs everything: the migration you started Monday, the bug from this morning, the unrelated question you had at lunch. Not because that is a good idea, but because opening a fresh session and re-establishing context is a small chore, and dumping one more thing into the window that is already open is not. So the window grows, and every turn re-reads all of it.
When a new workspace is one keystroke away, you actually open one. Each workspace re-reads only its own thread, so seven medium contexts cost far less per turn than one that contains all seven. The win is not discipline, it is that the cheap thing became the convenient thing.
One correction worth making, because it is easy to state wrong: an open terminal does not keep a cache warm. The cache lives server-side and expires on its lifetime whether or not your window is open. On a subscription that lifetime is an hour, so cycling through a handful of workspaces within an hour does keep them all valid — but that is the lifetime doing the work, not the terminal.
Put the number on screen
You cannot fix what you cannot see. My status line shows context fill and both plan windows, always. One non-obvious detail if you want to build on it:
rate_limits is delivered to the status line and to no hook payload. If you want a hook that reacts to how much of your plan you have burned, the status line has to write that data down for it.So my status line tees its stdin to a file, and a Stop hook reads it and warns me once per session when the 5-hour window passes 80%. Getting cut off mid-refactor is worse than the tokens.
The fastest thing you can check right now
Run /usage. On a subscription it shows a plan-usage breakdown with behavior flags: it names any behavior accounting for 10% or more of your recent usage, including cache misses and long context. It also attributes usage to skills, subagents, plugins and individual MCP servers.
If you are burning a plan and cannot work out why, the answer is usually sitting in that panel. Press d or w to switch between 24 hours and 7 days.
Four things I had wrong
Writing this up meant checking my own settings against the current docs, and four did not survive:
| What I had | What is actually true |
|---|---|
BASH_MAX_OUTPUT_LENGTH: 50000, described as insurance against unbounded output | The default is 30,000, so I had raised the limit, not capped it. It also sets the read-back window rather than what reaches context: output over ~30,000 characters arrives as a file path plus preview either way. |
MAX_MCP_OUTPUT_TOKENS: 25000 | 25,000 is the default. The setting did nothing. |
| Auto-compact override as a simple "compact earlier" knob | It can only lower the threshold, and only applies when the session compacts before the model's context limit. |
| A note to go enable deferred MCP tool loading | MCP tool search is on by default now. Nothing to do. |
Three of the four felt productive and did nothing. That is the normal state of a config file nobody re-reads.
Measuring your own
/usage                                 # plan windows + behavior flags
/context                               # what is eating your window right now
npx ccusage@latest daily --breakdown   # local history, split by model
npx ccusage@latest blocks --live       # the live 5-hour window
ccusage is third-party and reads only local session logs; nothing is uploaded.
The single number to look for is your cache-read share. If it is not in the 90s, something in your prefix is churning, and that is where your plan is going.
The config, as a repo
My settings, the status line, and the usage-guard hook are public and generic — no personal skills, no bespoke scripts. It ships a self-test and refuses to install if the test fails.